
 Login/Register
 Supplier Login


KIRIN Beer University, a virtual university on the Internet operated by Japan’s Kirin Company Limited, released its latest report on global beer consumption by country for 2017, revealing the decline year-on-year for a third consecutive year. Covering consumption in 170 countries and regions, the report is based on surveys from brewers’ associations as well as industry statistics across the globe.
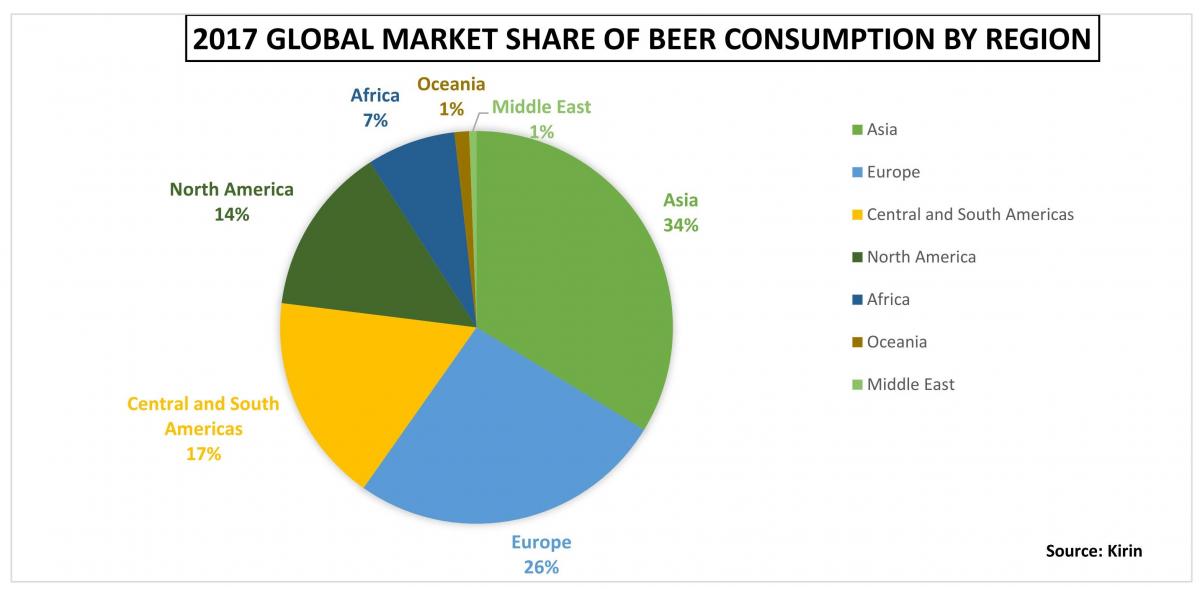
Consumption by region
In 2017, beer consumption reached 186.72 million kilolitres, a drop of 0.2% from 2016. By region, Asia has kept a strong lead, accounting for 33.7% share of the global beer market. This has been the trend for the past 10 years. In 2017, Asian consumption was at 62,946 thousand kilolitres or an equivalent of 99,441.1 million (633ml) bottles. However, overall consumption fell 0.8% compared to 2016. Despite this, there was a bright outlook for some Asian countries. Annual consumption increased in Vietnam (+5.8%), South Korea (+5.6%), Thailand (+15.8%), and the Philippines (+13.8).
It’s a different story in Africa which is enjoying seven years of continuing growth. In 2017, its consumption grew 0.5% from the previous year, reaching a total of 13,540 thousand kilolitres.
Consumption by country
By country, China still holds the top position with consumption of 40,143 thousand kilolitres and accounting for 21.5% of global market share. On the downside, these figures reflect a 3.9% slip year-on-year due to the maturing and saturation of consumer demand. However, beers within the mid- to high-range price bracket have been strong.
Kirin said the drop in China consumption resulted in a lower global beer consumption in 2017.
The company added that Vietnam registered an economic growth rate of 6.8% in 2017, the highest recorded growth rate since 2008. The country’s beer consumption increased by 5.8% compared to 2016 due to brisk consumer trends accompanying economic growth leading to an increase in beer intake.
Mexico’s consumption went up 6.8% to maintain growth for two straight years, moving up two notches from 6th to 4th. Within the top 20 countries, the United Kingdom, Vietnam, and Spain held on to their rankings even as their consumption increased. Thailand with a growth rate of 15.8% from 2016 to 2017, moved up from 19th position to 16th, while the Philippines jumped from 24th to 19th as its consumption increased by 13.8% year-on-year due to strong performance in manufacturing, service, and agriculture as well as sustained economic expansion, including an improvement in employment. The trend in alcohol consumption is also shifting from the mainstream brandy toward beer, said Kirin.
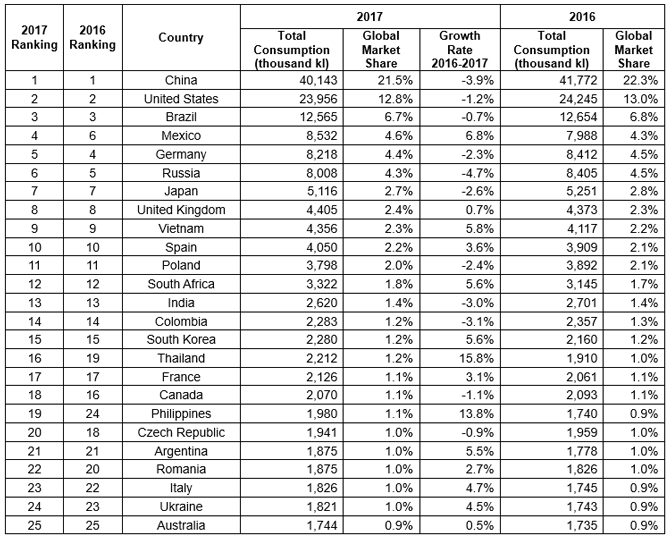
Source: Kirin
Per-capita beer consumption
As to per-capita beer consumption, the Czech Republic has lorded it over the rest for the past 25 years straight. Still consumption also slid to 183.1 litres or the equivalent of 289.3 (633ml) per capita in 2017, a drop of 2.4 bottles year-on-year.
Among the top 35 countries, 12 registered higher consumption from 2016 to 2017. Kirin noted Japan consumed 40.1 litres of beer—the equivalent of 63.4 bottles (633 ml)—on a per-capita basis in 2017, down 2.0 bottles year-on-year.
Central and South America, ranking third, recorded an increase of 1.3% from the previous year due to increased consumption in Mexico and Argentina of 6.8% and 5.5% respectively.
Notes:
- The volume of global consumption for the previous year has been updated (revised from 186.89 million kiloliters to 187.05 million kiloliters).
Source: Questionnaires sent by Kirin to the brewers’ associations in major countries.
The Barth Report Hops 2017/2018 (BARTH−HAAS GROUP)
Global Beverage Forecasts September 2018 (Canadean Ltd.)
- As of 2013, there has been a change in the industry statistics data source. Therefore, some of the data may not necessarily correspond with past reports.
Source: Kirin Beer University Report Global Beer Consumption by Country in 2017. https://www.kirinholdings.co.jp/english/news/2018/1220_01.html
Men Nike Air Huarache