 Login/Register
 Supplier Login


THE Gulf Organization for Industrial Consulting (GOIC) in its latest GCC Food Industries Directory reports the growth in the food sector from 2010 to 2014.
The number of food factories operating in the GCC expanded from 1,606 to 1,965, a CAGR of 5.2%, and the number of workers increased from 159,613 workers to 238,825, a CAGR of 10.6%. In the same period, investments rose from US$13,688 million to US$23,757, a CAGR of 14.8%.
The food sector accounts for about 12.1% of the total manufacturing industries, about 6.2% of the total investments and 15.6% of the total manufacturing labor force, said GOIC Secretary General Mr Abdulaziz Bin Hamad Al-Ageel.

GOIC Secretary General Mr Abdulaziz Bin Hamad Al-Ageel
“The food industries sector is one of the main pillars of a sturdy economy; it is an important sector that is based on agricultural activities and developing animal resources and fisheries,” Mr Al-Ageel said. “Thus, GOIC endeavoured to provide concerned parties with a variety of easily accessible data on these industries in a scientific fashion in accordance with international standards in the area of directories.”
GOIC provides documented and updated outputs prepared by its experts based on its developed databases, as well as offers consulting services, researches and studies. The publications are reference materials which aim to help decision makers, researchers, investors and all stakeholders in their efforts to develop the economy of the region, said Mr Al-Ageel.
Charts courtesy of the GOIC:
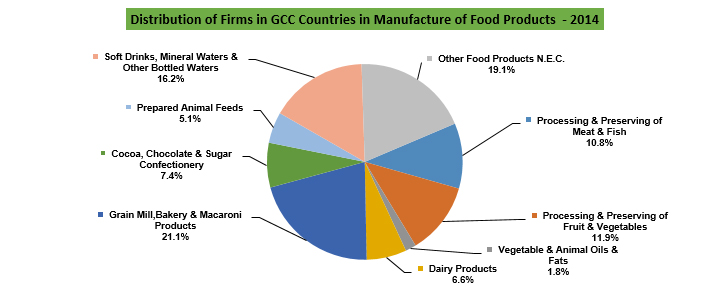
Number of food manufacturing factories in GCC countries according to industrial activity
|
No. of Firms |
2010 |
2011 |
2012 |
2013 |
2014 |
Growth Rate 5 Years |
2014% |
|
Processing & Preserving of Meat & Fish |
171 |
196 |
208 |
204 |
212 |
5.5% |
10.8% |
|
Processing & Preserving of Fruit & Vegetables |
175 |
208 |
210 |
204 |
234 |
7.5% |
11.9% |
|
Vegetable & Animal Oils & Fats |
32 |
36 |
36 |
38 |
35 |
2.3% |
1.8% |
|
Dairy Products |
152 |
149 |
145 |
138 |
130 |
-3.8% |
6.6% |
|
Grain Mill, Bakery & Macaroni Products |
376 |
411 |
420 |
418 |
414 |
2.4% |
21.1% |
|
Cocoa, Chocolate & Sugar Confectionery |
106 |
128 |
139 |
133 |
145 |
8.1% |
7.4% |
|
Prepared Animal Feeds |
77 |
84 |
96 |
95 |
101 |
7.0% |
5.1% |
|
Soft Drinks, Mineral Waters & Other Bottled Waters |
231 |
258 |
292 |
285 |
318 |
8.3% |
16.2% |
|
Other Food Products N.E.C. |
286 |
302 |
359 |
342 |
376 |
7.1% |
19.1% |
|
Manufacture of Food Products |
1,606 |
1,772 |
1,905 |
1,857 |
1,965 |
5.2% |
100.0% |
Investments in GCC food industries according to industrial activity
|
Investment - Million $ |
2010 |
2011 |
2012 |
2013 |
2014 |
Growth Rate 5 Years |
2014% |
|
Processing & Preserving of Meat & Fish |
1,283 |
1,424 |
1,492 |
1,603 |
2,218 |
14.7% |
9.3% |
|
Processing & Preserving of Fruit & Vegetables |
728 |
834 |
842 |
828 |
928 |
6.2% |
3.9% |
|
Vegetable & Animal Oils & Fats |
526 |
641 |
641 |
646 |
689 |
7.0% |
2.9% |
|
Dairy Products |
1,958 |
3,033 |
2,914 |
3,038 |
4,491 |
23.1% |
18.9% |
|
Grain Mill, Bakery & Macaroni Products |
4,041 |
4,518 |
4,259 |
4,629 |
4,715 |
3.9% |
19.8% |
|
Cocoa, Chocolate & Sugar Confectionery |
755 |
749 |
970 |
922 |
1,124 |
10.5% |
4.7% |
|
Prepared Animal Feeds |
796 |
1,050 |
1,131 |
1,160 |
1,852 |
23.5% |
7.8% |
|
Soft Drinks, Mineral Waters & Other Bottled Waters |
2,588 |
3,174 |
3,301 |
3,396 |
5,844 |
22.6% |
24.6% |
|
Other Food Products N.E.C. |
1,013 |
1,154 |
1,892 |
1,844 |
1,895 |
16.9% |
8.0% |
|
Manufacture of Food Products |
13,688 |
16,575 |
17,443 |
18,066 |
23,757 |
14.8% |
100.0% |